Predicting Student Educational Outcomes
Using Machine Learning and Pattern Mining to Predict Educational Outcomes
La Monte Henry Piggy Yarroll, Christopher A. Murphy, Padmaja Kurumaddali
Spring Term, 2024
Project Overview
This project aimed to predict student academic outcomes (Dropout, Enrolled, Graduate) using a variety of machine learning algorithms and association rule mining techniques. The analysis sought to identify early-warning patterns and predictor interactions that could help universities take preemptive actions to support at-risk students.
Problem Statement
Higher education dropout rates impact not just individual students, but also institutional performance and broader economic development. Can machine learning techniques highlight key attributes to predict outcomes and highlight opportunities for effective interventions?
Methods
EDA & clustering: Visualized distributions/relationships (notably credit-load correlations); explored structure with K-Means; ran variants with/without PCA.
Pattern mining: Used Apriori (support/confidence/lift) to surface interpretable dropout/graduation patterns.
Modeling: Trained and compared multiple classification models and summarized accuracy and key predictors.
Binomial Logistic Regression - Select Attributes
Multinomial Logistic Regression - All Attributes
Multinomial Logistic Regression - Select Attributes
Support Vector Machine - Linear
Support Vector Machine - Polynomial
Random Forest, Variable Tree Numbers (with and without PCA)
Random Forest, K-Fold (with and without PCA)
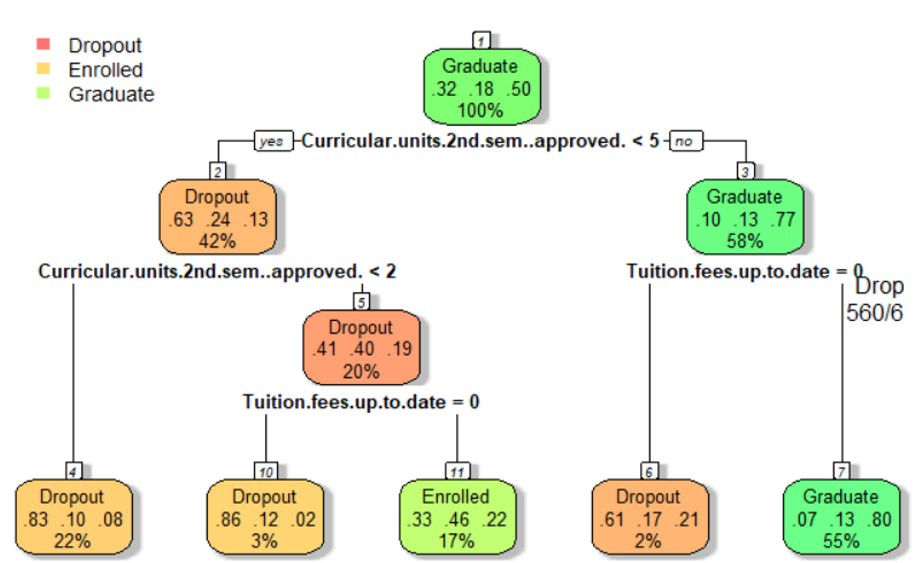
Decision Tree
KNN (with and without PCA)
Naive Bayes, K-Fold (with and without PCA)
Most Common Value
Random Guess
Key Learnings
Credit progress and scholarship status are the strongest predictors; adding non-academic features (engagement, course difficulty, motivation) could further boost accuracy.
Combining ARM with ML improves both interpretability and guided feature selection.
Visualizations


Competencies Employed
Data-Driven Decision Making
Transforming raw data into actionable business or policy insights.
Exploratory Data Analysis (EDA)
Discovering patterns and relationships in data using visual and statistical techniques.
Data PipeLines
Designing and automating workflows for ingesting, transforming, and delivering data reliably across systems to support analysis and machine learning
Applied Machine Learning
Implementing ML algorithms to solve real-world problems and optimize outcomes.
Strategy & Decisions
Developing alternative strategies based on the data analysis.
Statistical Modeling
Applying regression, hypothesis testing, and probabilistic methods for inference.
Insights & Recommendations
Turn analysis into clear, prioritized stakeholder actions with rationale, trade-offs, and measurable outcomes.
R Coding
Writing R scripts for statistical analysis, data visualization, and machine learning, particularly in academic, research, and analytical workflows.
Data Collection
Acquire, ingest, validate, and organize data using reproducible workflows and transformations to ensure compatibility with downstream data-science algorithms.
Predictive Modeling
Using statistical or machine learning models to make future predictions.
Data Engineering
Designing and implementing systems for data collection, storage, and access.
Communication
Succinctly communicate complicated technical concepts.
Project Management
Planning, executing, and managing data science projects across teams and phases.
Scripting for Analysis
Automating data processes and analysis using scripting languages like Python or R.
Additional Technical Information
Data Source(s)
The dataset was compiled from higher education institutions, capturing student-level academic and demographic data with their final academic outcome (Dropout, Graduate, Enrolled).
UCI Repository: Dataset #697
Results Summary
The best-performing model was binomial logistic regression with selected features, achieving 85.22% accuracy. SVM (linear) and random forests also performed well.
PCA did not significantly improve accuracy in most cases.
Future Improvements
Add semester-level time series and student-support data; turn ARM patterns into features.
Introduce ensemble boosting techniques (XGBoost or LightGBM) for possible performance gains.
Build a decision support dashboard to enable real-time alerts and visualization for academic advisors monitoring student risk.